
Asset identity and operating boundary
What the operation is, what it produces, where its reporting boundary falls and what sits inside it.
Industrial intelligence platform
One analytical engine, built to link the evidence that normally sits in separate places — asset identity and operating boundary, energy and fuel, emissions and compliance exposure, spatial and network context, ownership and contract control, project stage and sector comparators. It reconstructs an operation from the record, reconciles that reconstruction against an independently built account, and separates what is known from what is inferred and what is still missing.
The unifying idea
A policy question, an investment question and an asset question look unrelated until you notice they all resolve to the same entities. A facility belongs to a company, hosts a project, consumes energy, reports emissions, connects to a grid, runs a technology, sits under an approval and competes for capital. Link those once and every question after that reuses the link rather than rebuilding it.
The links are the asset, not the individual records. Each one is established from evidence and carries the grade it was established at.
The same graph, entered from four different directions. What changes is where the question starts and which links it follows — not the underlying evidence.
It is an internal analytical structure, built asset by asset as work is done. It is not complete national coverage, not a queryable database and not a live feed. Entities are linked where the evidence supports a link and left unlinked where it does not — which is why the count of what has been analysed in depth is much smaller than the count of what has been mapped as background context.
What it is for
The same engine serves different questions depending on who is asking. In every case the product is decision support — evidence assembled and graded so that a decision can be made, or deferred, on stated grounds.
| Who | Decision supported |
|---|---|
| Asset owner or operator | Establish the current energy, emissions and control position before considering any change to it |
| Project developer | Identify host constraints, missing evidence, and whether a concept merits further work at all |
| Investor, lender or adviser | Screen asset or project exposure, and determine what requires formal diligence |
| Government or industry body | Understand facility, sector or portfolio patterns from reconciled public evidence |
An internally developed analytical capability. It is not client-operated software, not a public or queryable database, and not a substitute for formal due diligence. Outputs are screening support, decision support and investment-readiness evidence — not investment recommendations, certified engineering, or legal or financial product advice.
What it connects
What the operation is, what it produces, where its reporting boundary falls and what sits inside it.
Fuel type and quantity, purchased electricity, self-generation and reconstructed average load.
Reported positions, Safeguard baseline and decline path, and the exposure that follows from them.
Location, distance to infrastructure and site constraints, with stated precision and stated limits.
Who owns the plant, who operates it, and what long-term agreements determine who can decide.
Configuration, delivery parties and the readiness questions that determine whether a concept can advance.
Peers on the measures that are genuinely comparable, and the sector total the asset has to sum into.
Several outputs from one engine, rather than several products with separate machinery behind them.
The full reconstruction of an operating asset, reconciled and graded.
A first structured look at whether an early concept merits further work.
The F1–F4 workflow applied in depth to a project that has passed the screen.
Exposure and control structure for a party assessing an asset or a project.
Patterns across a commodity, a sector or a group of assets, reconciled against national accounts.
The precise short list of items only the operator holds, and validation once they arrive.
How information flows
The F1–F4 Pre-DD workflow is one downstream route through this — the one that applies when the question is a proposed project. It is a use case, not the architecture.
Featured use case
The strongest single application, and the one most often skipped. Before anyone proposes anything for a plant or a mine, there is a prior question that is usually assumed rather than answered: what does this operation actually consume, burn, emit, produce and owe — and who is in a position to decide anything about it?
Fuel mix and quantity, self-generation versus purchased electricity, reconstructed average load, and where the asset sits relative to the network. Fuel type is established from evidence, not assumed from the industry code — an assumption that is wrong often enough to matter.
Baseline, decline path and projected compliance position under the Safeguard Mechanism, priced against a revenue proxy. Including the statutory baseline floor, which standard projections run straight through — and the resulting band in which abatement earns no credit at all.
Ownership and operator structure, including the common case where the power station belongs to a third party under a long-term agreement and its fuel is reported under a different industry entirely. Contract end dates where they are disclosed.
The asset compared to its peers on the measures that are actually comparable, and the asset summed with its peers to test whether the sector view holds. Both directions, because each one catches errors the other does not.
The inventory work is what makes everything above possible. It is built once and used by the asset, project, investment and sector outputs alike:
Method — the defensible part
A single-source number is an assertion. The discipline here is to reconstruct the asset from filings and then test the result against an account assembled from an unrelated source — national energy statistics, an independent pollutant inventory, company disclosure, trade data. Where the two disagree, the disagreement is the finding.
Build the asset upward from filings and licences rather than downward from a sector average.
Test the build against an independently constructed account, with disjoint inputs required for the check to count.
Identify control boundaries — third-party plant ownership, long-term agreements — that decide who can act on any of it.
Evidence discipline
Settled negatives, not gaps waiting to be filled by more searching. Any analysis that appears to have these without the owner should be treated with suspicion.
| Not available | Why it matters |
|---|---|
| Interval load curve | Nothing can be sized or priced without it |
| Peak demand | Determines connection and equipment, not average load |
| Unit run hours and standby strategy | Separates a continuous plant from a backup set |
| Contract price and volume terms | Decides who captures a saving, which often decides whether anything happens at all |
Work can end in four honest results: continue, redesign, supplement data — or stop. An analysis that says “pause” is the method working, not failing.
What a buyer receives
The coverage maps show reach; this shows the shape of the output. Each line carries its own evidence grade, and the unresolved lines are as much a part of the deliverable as the resolved ones.
Platform coverage
A selected, non-confidential view: industrial sites, generalised energy infrastructure and spatial context in the same analytical frame. Around 8,000 sites are mapped as background context, which is what allows a single operation to be placed against its network, its neighbours and its sector. That is not a claim of complete national coverage, and a much smaller number have been analysed in depth — that count is on the track record page. This preview is deliberately aggregated: not a public database, not a query tool, and individual assets cannot be identified from it.
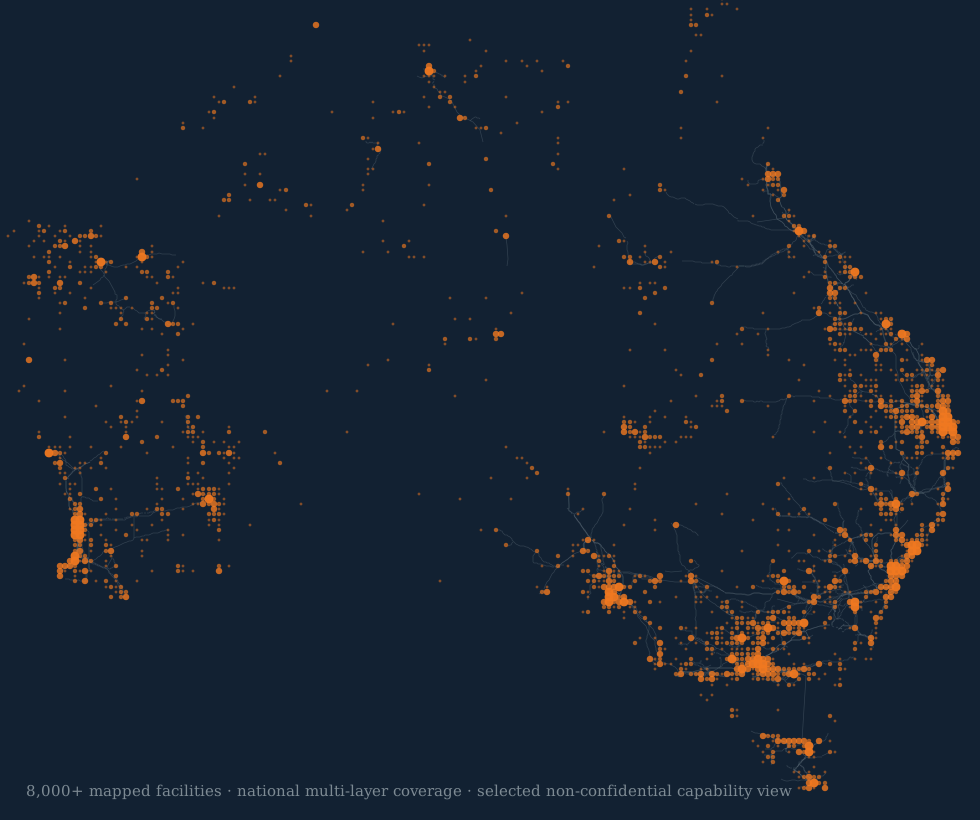
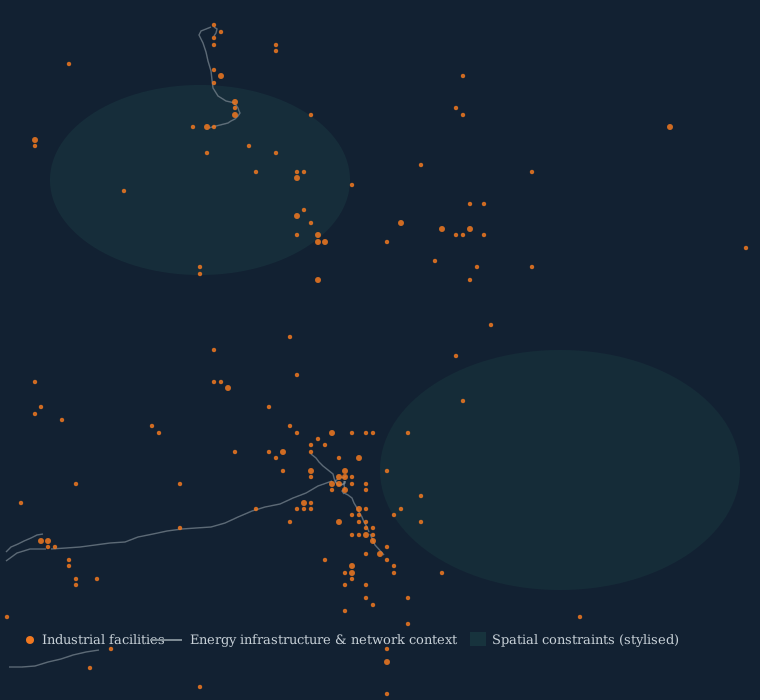
Positions are aggregated and generalised for publication. Sources, methods, scoring and underlying records remain internal.
Boundaries
Public examples show the decision framework and selected non-confidential outputs. The underlying source architecture, analytical rules, model controls, internal scoring and opportunity assessments remain confidential. Case examples use public information and agreed inputs; evidence records and analysis trails are maintained internally.
Heliovulcan does not provide financial product advice, investment recommendations, certified engineering, or formal legal or lender due diligence. Where a question needs any of those, the output is the evidence and the question list that a licensed or certified party would start from.
Where to start
An asset question, a project question and a sector or policy question all route to the same short, non-confidential first exchange — there is nothing to choose between first. A site name, a sector or a consultation paper is often enough to establish whether the question can be answered from the record at all.