
Heliovulcan
Facility-level analysis of Australian industry, energy and emissions
We build facility- and project-level accounts from regulatory filings, licences and company disclosures. We cross-check the key figures against independent sources and identify what is reported, calculated, assumed or still unknown.
Selected findings
What the evidence shows
The post-2030 decline rate cannot be set in isolation
3.53 pp/yrpost-2030 decline required for a 62% target on the starting-point assumptions, against a statutory 3.285For any fixed 2035 target, slower reductions for one group require faster reductions elsewhere. Production, new projects and closures also change the rate required. The model uses every facility in the FY2024–25 Safeguard register.
Sector study · Mine energyThe largest future mine-electrification loads may not appear in current electricity data
3.9–4.65 GWtheoretical average electrical load if reported mining diesel (299.6 PJ) were fully converted; about 70–90% of mining’s current electricity consumptionMining reported 299.6 PJ of diesel, most of it used by mobile equipment that does not appear as electricity demand. Converted to electricity that is a theoretical 3.9–4.65 GW of average load. The addressable market is smaller and depends on fleet timing, mine life, power supply and fuel tax credits.
Submission · Senate inquiryAustralia’s data-centre regulatory records are not connected at the facility level
6regulatory systems (energy reporting, grid connection, planning, environmental, water, rating) each hold part of the record; no public facility-level crosswalk was foundEnergy, planning, environmental, water and rating systems each hold part of the record, but we found no public crosswalk connecting them to the same physical site. We recommend a common facility identifier, a clear record of which rules apply to each site, and consistent definitions for energy and water data.
What we analyse
Analysis built around the asset
Understand an operating asset
We reconstruct an operation’s energy use, emissions, ownership and regulatory obligations, then check the results against independent data.
How an asset is analysed →Test an energy project
We test the site, approvals, connection, contracts and financing before the developer commits substantial development funds.
Project screens →Measure a market or policy change
We estimate markets from facility data and show how policy changes affect individual facilities. We publish the sources, assumptions and unanswered questions.
Research →Tools and data
Explore the data and methods
Safeguard Atlas
Model 208 facilities to 2035 and test different policy settings. The Atlas rebuilds the national pathway from each facility’s baseline and reported emissions, and recalculates in the browser.
Open the Atlas → MethodsHow each account is built, tested and labelled
Visual maps of mining hybrid development, financial close and industrial PV+BESS stakeholders.
Open the maps → ConsultationsSubmissions and supporting evidence
We publish each submission with the sources, calculations and unresolved questions behind it.
Read the submissions →Selected project
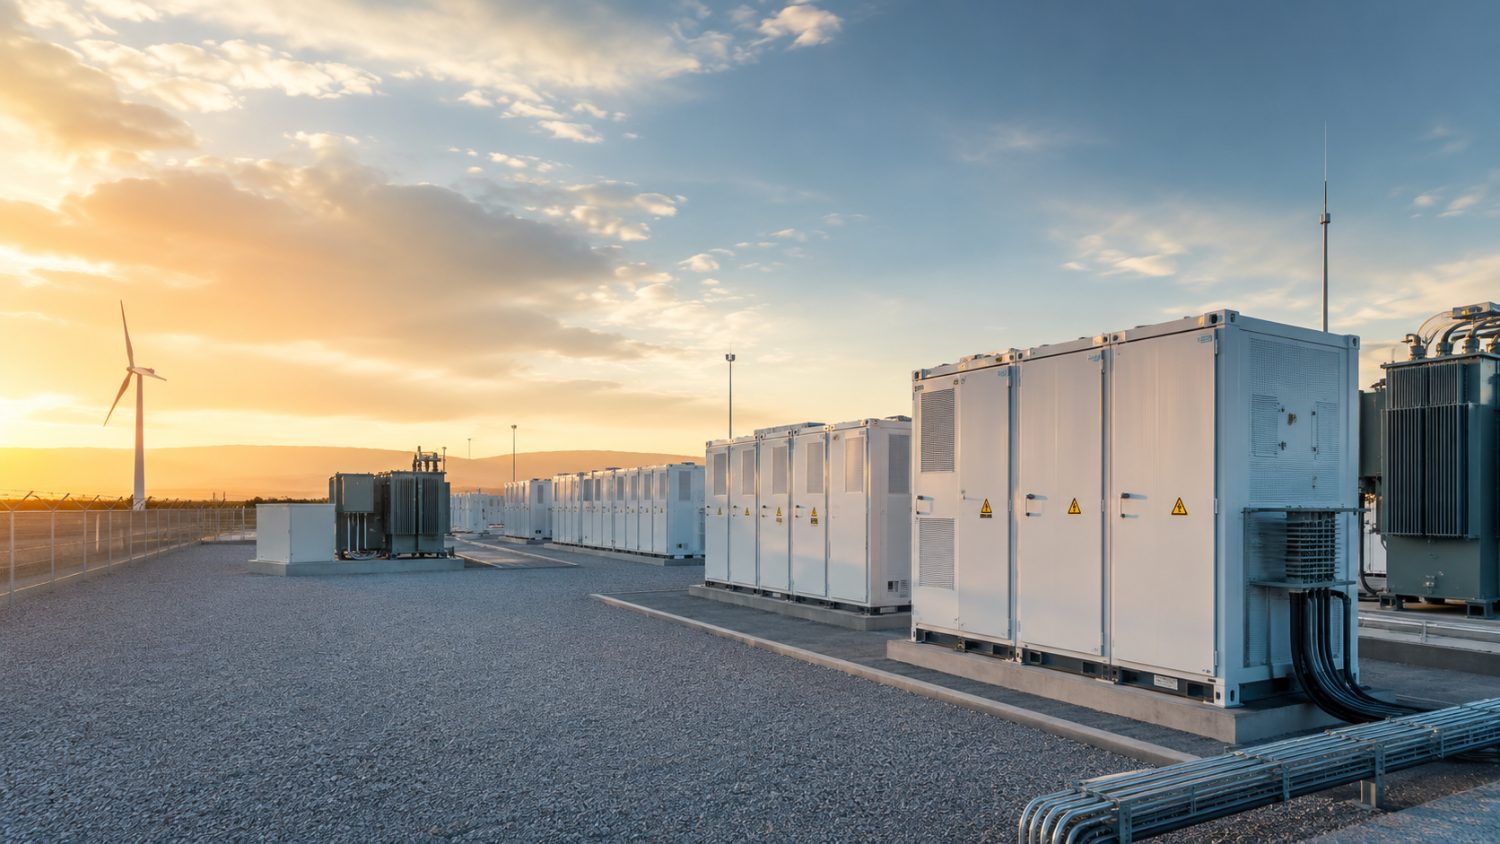
Screening a 60% renewable pathway for a remote Northern Territory mine
A screen of a hybrid solar, battery and diesel pathway using public information: approvals, site, microgrid boundary and the financing case, run before any development cost is committed. Of the four options screened, the 60% renewable hybrid was the best candidate for detailed hourly modelling and commercial testing.
Built from regulatory filings, licence records and company disclosures. We label calculated results, assumptions and unanswered questions. Nothing here is a compliance determination, a forecast or financial advice.
Have a facility, project or policy question?
Send a short, non-confidential description of the facility, project, sector or policy question. An initial conversation is usually enough to tell whether public information can help.